Create a table counting all AEs.
Usage
tbl_ae_count(
  data,
  ae,
  soc = NULL,
  by = NULL,
  strata = NULL,
  by_values = NULL,
  digits = NULL,
  sort = NULL,
  zero_symbol = "\U2014",
  missing_location = c("first", "last", "hide")
)
Arguments
- data
Data frame
- ae
Variable name of the adverse event column
- soc
Variable name of the system organ class column
- by
Variable to split results by, e.g. report AEs by grade
- strata
Variable to stratify results by, e.g. report AEs summaries by treatment group
- by_values
Optional vector of complete by values, listed in desired order, to achieve correct table structure for the situation in which an adverse event of a certain grade is not observed for a given soc
- digits
Specifies the number of decimal places to round the summary statistics. By default integers are shown to zero decimal places, and percentages are formatted with
style_percent(). If you would like to modify either of these, pass a vector of integers indicating the number of decimal places to round the statistics. For example, if the statistic being calculated is"{n} ({p}%)"and you want the percent rounded to 2 decimal places usedigits = c(0, 2). User may also pass a styling function:digits = style_sigfig- sort
Controls order of AEs and SOCs in output table. The default is
NULL, where AEs and SOCs are sorted alphanumerically (and factors sorted according to their factor level). Usesort = "ae"to sort AEs in decreasing frequency order,sort = "soc"to sort SOCs in decreasing order, andsort = c("ae", "soc")to sort both. AEs are sorted within SOC.- zero_symbol
String used to represent cells with zero counts. Default is the em-dash (
"\U2014"). Usingzero_symbol = NULLwill print the zero count statistics, e.g."0 (0)"- missing_location
location where the column summarizing values with missing levels
by=will be located in the final table. Must be one ofc("first", "last", "hide). Default is"first"
Details
tbl_ae_count counts all AEs (whereas tbl_ae
counts by maximum grade). Thus, tbl_ae_count does
not provide percentages as multiple AEs can be counted per subject.
Examples
# \donttest{
# Example 1 -----------------------------------------------------------------
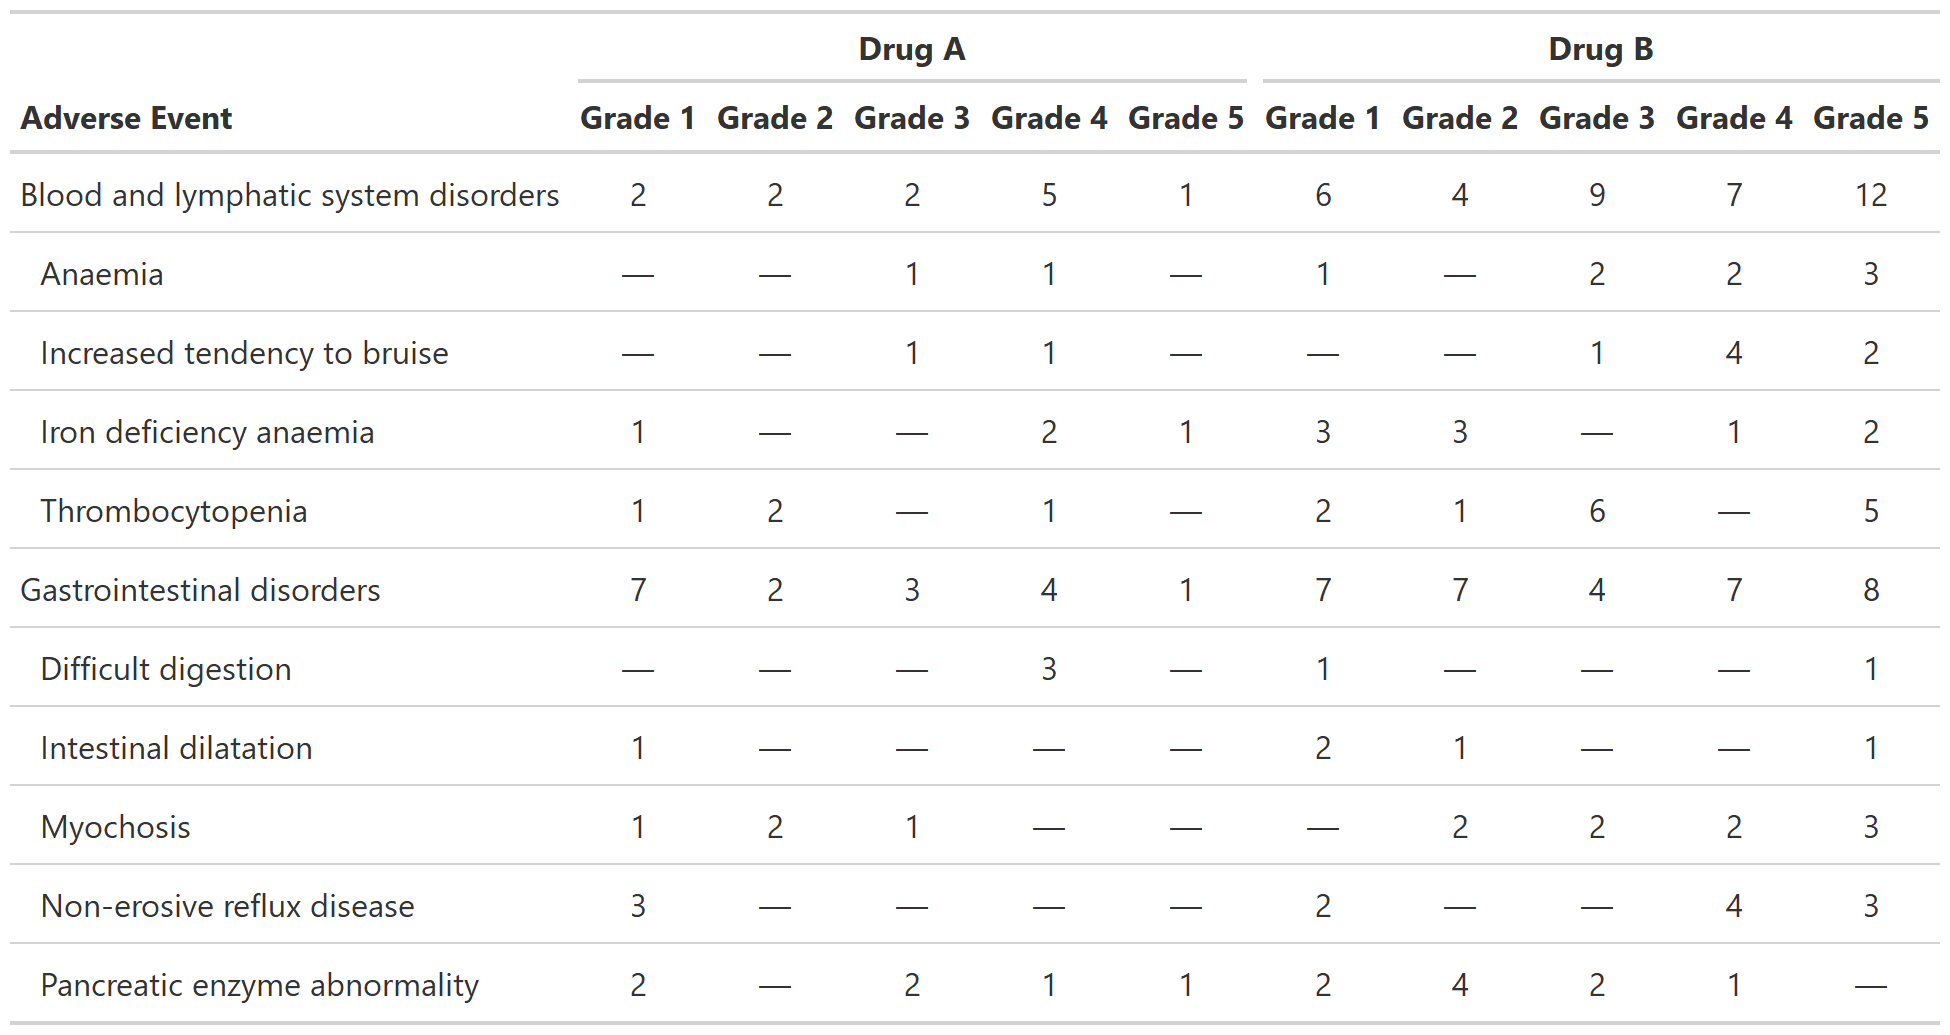
tbl_ae_count_ex1 <-
tbl_ae_count(
data = df_adverse_events,
ae = adverse_event,
soc = system_organ_class,
strata = trt,
by = grade
) %>%
modify_header(all_ae_cols() ~ "**Grade {by}**")
# }