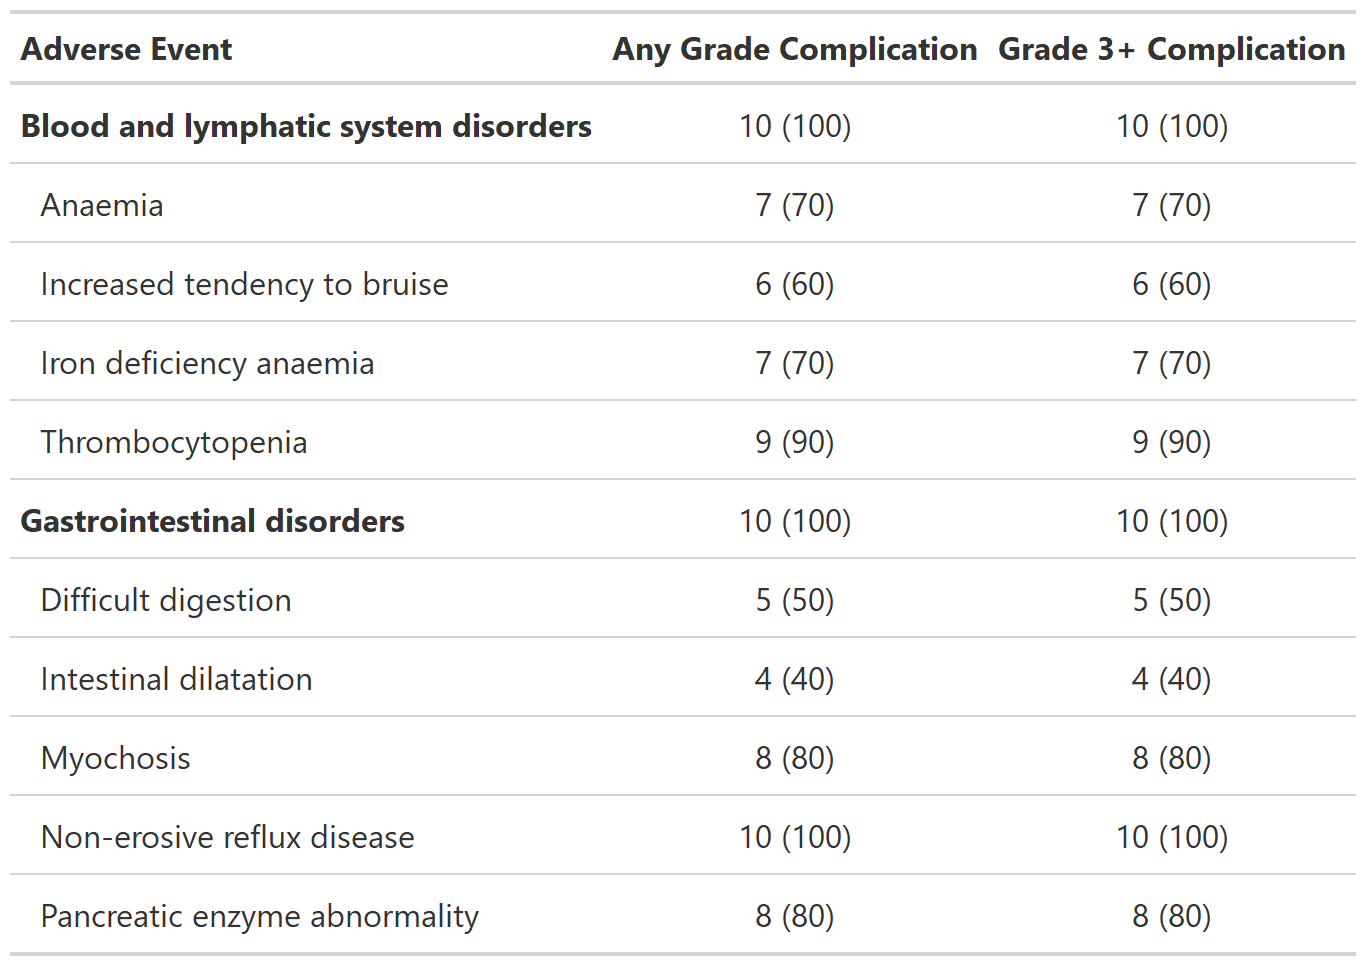
Summarize dichotomous AE data. For example, report the rate of patients that have an AE of Grade 3 or higher.
Usage
tbl_ae_focus(
  data,
  include,
  id,
  ae,
  soc = NULL,
  strata = NULL,
  label = NULL,
  id_df = NULL,
  statistic = "{n} ({p})",
  digits = NULL,
  sort = NULL,
  zero_symbol = "\U2014"
)
Arguments
- data
Data frame
- include
Vector of column names to summarize. Column names may be quoted or unquoted. All columns must be class 'logical'.
- id
Variable name of the patient ID
- ae
Variable name of the adverse event column
- soc
Variable name of the system organ class column
- strata
Variable to stratify results by, e.g. report AEs summaries by treatment group
- label
A named list of labels that will be applied in the resulting table. Names must be those passed in
include=. Default is NULL, and either the label attribute or the column name will be used.- id_df
Optional data frame of complete id values and strata to achieve correct base n for the situation in which not all subjects experience adverse events. See
df_patient_characteristicsfor an exampleid_dfthat pairs withdf_adverse_events.- statistic
String indicating the statistics that will be reported. The default is
"{n} ({p})"- digits
Specifies the number of decimal places to round the summary statistics. By default integers are shown to zero decimal places, and percentages are formatted with
style_percent(). If you would like to modify either of these, pass a vector of integers indicating the number of decimal places to round the statistics. For example, if the statistic being calculated is"{n} ({p}%)"and you want the percent rounded to 2 decimal places usedigits = c(0, 2). User may also pass a styling function:digits = style_sigfig- sort
Controls order of AEs and SOCs in output table. The default is
NULL, where AEs and SOCs are sorted alphanumerically (and factors sorted according to their factor level). Usesort = "ae"to sort AEs in decreasing frequency order,sort = "soc"to sort SOCs in decreasing order, andsort = c("ae", "soc")to sort both. AEs are sorted within SOC.- zero_symbol
String used to represent cells with zero counts. Default is the em-dash (
"\U2014"). Usingzero_symbol = NULLwill print the zero count statistics, e.g."0 (0)"
Examples
# \donttest{
# Example 1 -----------------------------------------------------------------
tbl_ae_focus_ex1 <-
  df_adverse_events %>%
  tbl_ae_focus(
    include = c(any_complication, grade3_complication),
    id = patient_id,
    ae = adverse_event,
    soc = system_organ_class,
    label =
      list(any_complication = "Any Grade Complication",
           grade3_complication = "Grade 3+ Complication")
  ) %>%
  bold_labels()
  # }