Function creates a gtsummary-class listing of data. Column labels are used as column headers, when present. The listing prints observations in the order of the input data.
group_by
The grouping column and the first column in the table will be combined
and the type/class may be converted to common type/class for both columns.
However, if either the group_by= column or the first column are factors,
the factor column(s) will first be converted to character.
The groups are ordered according to the grouping variable's type (i.e., character, numeric, or factor).
Details
The purpose of tbl_listing() is to add support for printing data frames,
while taking advantage of the {gtsummary} defaults, e.g. ability to print
to most output formats, using print themes to have a common style to all
tables in a document, etc.
While the output of tbl_listing() is class 'gtsummary', these tables
are not meant to be merged with other 'gtsummary' tables with tbl_merge(),
or reporting table contents with inline_text(). The reason is that a
proper 'gtsummary' contains
additional, hidden structure
not present in the result of tbl_listing(). If you do need to report
the results of tbl_listing() in-line, it's recommended to convert
the table to a data frame, then extract the needed cell, e.g.
tbl_listing() |>
  as_tibble(col_names = FALSE) |>
  dplyr::slice(1) |>
  dplyr::pull(colname)`
Examples
library(dplyr, warn.conflicts = FALSE)
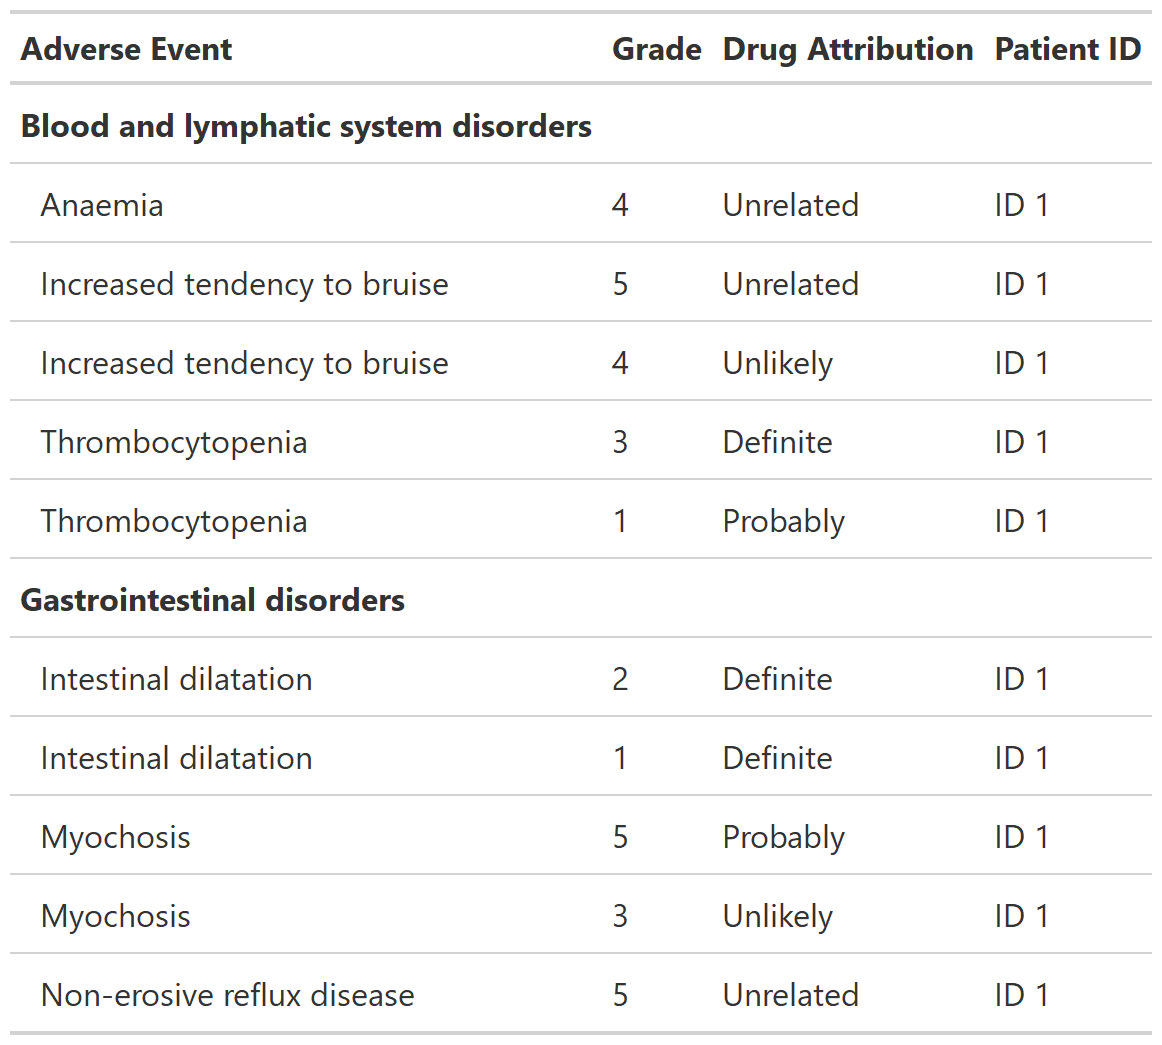
tbl_listing_ex1 <-
head(df_adverse_events, n = 10) %>%
select(system_organ_class, adverse_event, grade, drug_attribution, patient_id) %>%
arrange(adverse_event, desc(grade)) %>%
tbl_listing(group_by = system_organ_class) %>%
bold_labels()
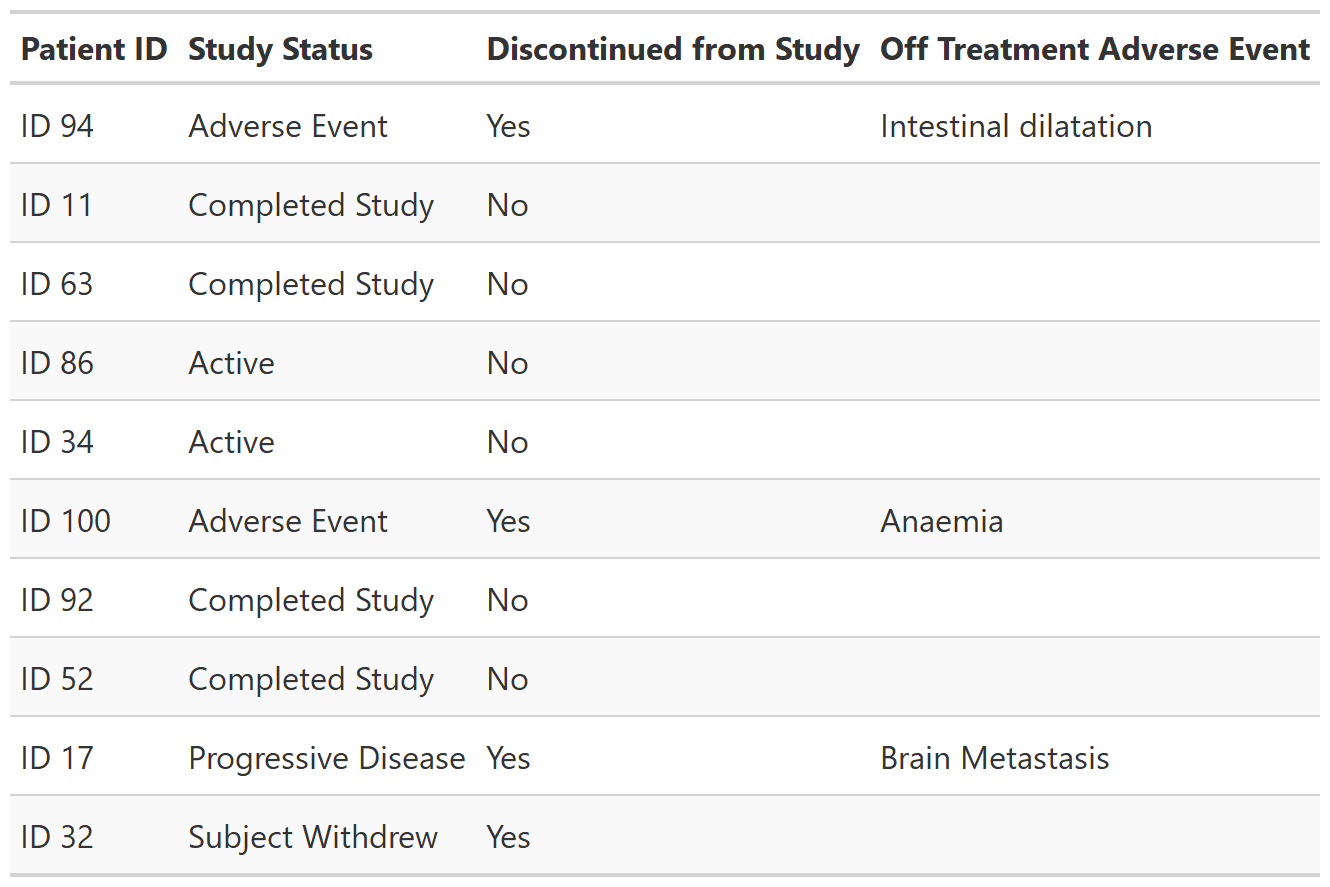
set.seed(11234)
tbl_listing_ex2 <-
df_patient_characteristics %>%
dplyr::slice_sample(n = 10) %>%
select(patient_id, status, discontinued, off_trt_ae) %>%
tbl_listing() %>%
as_gt() %>%
gt::opt_row_striping()