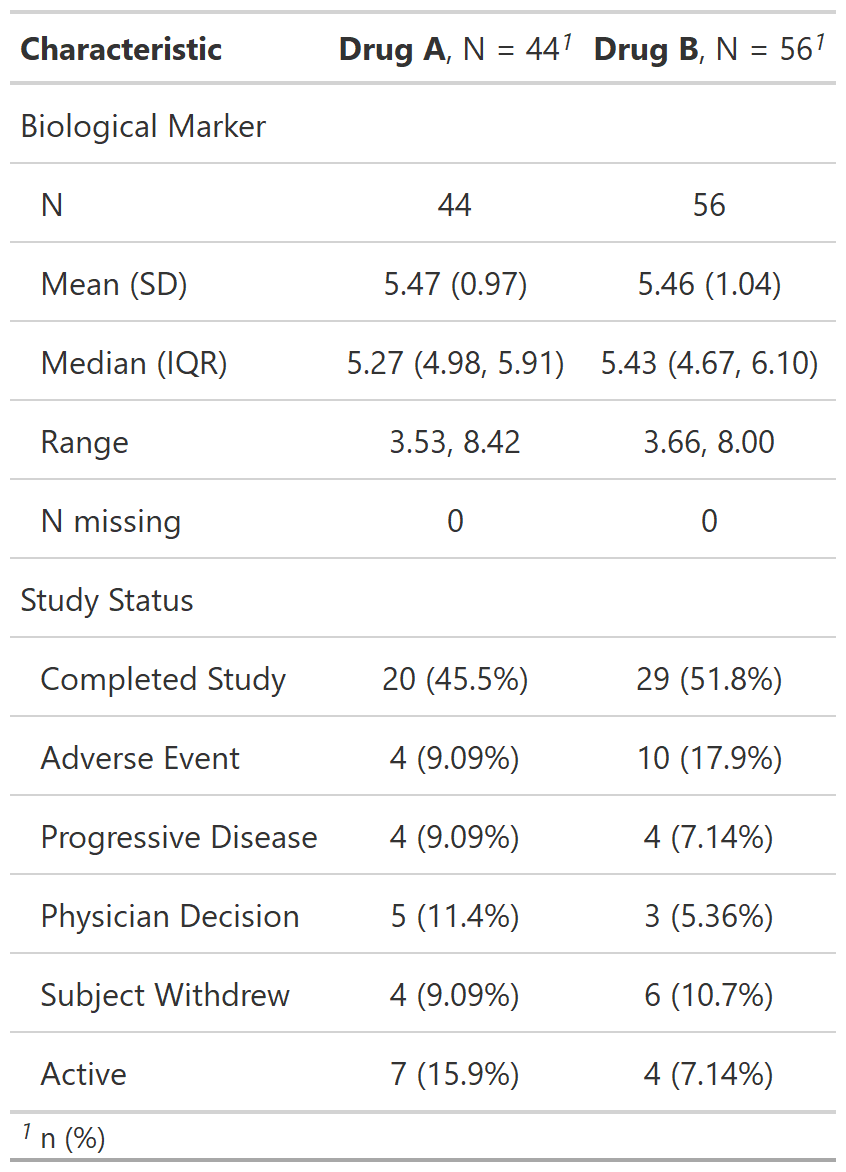
Function wraps gtsummary::tbl_summary() to create a data summary
table often seen in regulatory submissions. Continuous variable summaries
are shown on multiple lines with additional summary statistics and percentages
are shown for categorical variables; precision levels estimated based on values observed.
Usage
tbl_reg_summary(
  data,
  by = NULL,
  label = NULL,
  statistic = list(all_continuous() ~ c("{N_nonmiss}", "{mean} ({sd})",
    "{median} ({p25}, {p75})", "{min}, {max}", "{N_miss}"), all_categorical() ~
    "{n} ({p}%)"),
  digits = NULL,
  type = NULL,
  value = NULL,
  missing = c("no", "yes", "ifany"),
  missing_text = "Unknown",
  missing_stat = "{N_miss}",
  sort = all_categorical(FALSE) ~ "alphanumeric",
  percent = c("column", "row", "cell"),
  include = everything()
)
Arguments
- data
(
data.frame)
A data frame.- by
A column name (quoted or unquoted) in
data.Summary statistics will be calculated separately for each level of the by variable (e.g.by = trt). IfNULL, summary statistics are calculated using all observations.- label
(
formula-list-selector)
Used to override default labels in summary table, e.g.list(age = "Age, years"). The default for each variable is the column label attribute,attr(., 'label'). If no label has been set, the column name is used.- statistic
List of formulas specifying types of summary statistics to display for each variable.
- digits
(
formula-list-selector)
Specifies how summary statistics are rounded. Values may be either integer(s) or function(s). If not specified, default formatting is assigned viaassign_summary_digits(). See below for details.- type
List of formulas specifying variable types. Accepted values are
c("continuous", "continuous2", "categorical", "dichotomous"), e.g.type = list(age ~ "continuous", female ~ "dichotomous"). If type not specified for a variable, the function will default to an appropriate summary type.- value
List of formulas specifying the value to display for dichotomous variables. gtsummary selectors, e.g.
all_dichotomous(), cannot be used with this argument.- missing, missing_text, missing_stat
Arguments dictating how and if missing values are presented:
missing: must be one ofc("ifany", "no", "always").missing_text: string indicating text shown on missing row. Default is"Unknown".missing_stat: statistic to show on missing row. Default is"{N_miss}". Possible values areN_miss,N_obs,N_nonmiss,p_miss,p_nonmiss.
- sort
(
formula-list-selector)
Specifies sorting to perform for categorical variables. Values must be one ofc("alphanumeric", "frequency"). Default isall_categorical(FALSE) ~ "alphanumeric".- percent
(
string)
Indicates the type of percentage to return. Must be one ofc("column", "row", "cell"). Default is"column".In rarer cases, you may need to define/override the typical denominators. In these cases, pass an integer or a data frame. Refer to the
?cards::ard_tabulate(denominator)help file for details.- include
(
tidy-select)
Variables to include in the summary table. Default iseverything().
See also
See gtsummary::tbl_summary() help file
See vignette for detailed tutorial